Neighbourhoods and Bubbles
As I tackled this challenge in the Ontario Extend Collaborator module I became very aware of the number of people in my PLN in a variety of spaces and places, purposes and passions. The Google drawing does not allow for the full extent of people involved in each of the locations and passions identified. I’ve often wondered if I’ve surpassed my Dunbar number, but that’s for another investigation.
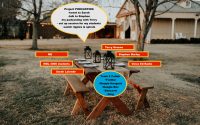
This mapping task allowed me to craft a diagram based on the Visitors & Residents model developed by David White and Alison Le Cornu. Since I’ve used this framework in my teaching, I thought it would be particularly useful as a model for student responses. The PLN ‘bubbles’ are located in the area on the map where they are situated – personal or professional, visitor (where I dip in and out of activities) or resident (where I engage consistently).
The diagram – When Bubbles Collide – provides a short list of people in each PLN, with a much larger list of participants and connections that could be included. I tend to keep lists in Twitter to help me remember those in my PLN circles so that I can engage with them when topics, items of interest or activities connect us more deeply.

Each of these PLNs has been developed over time and there are ebbs & flows of activities based on calendar, schedule and events. This map is a point at this moment of reflection and will iterate over time. It is never static, always in movement across the neigbourhoods in which I interact. Sometimes, these bubbles collide around other events or purposes.