March 30, 2019
Data Visualization
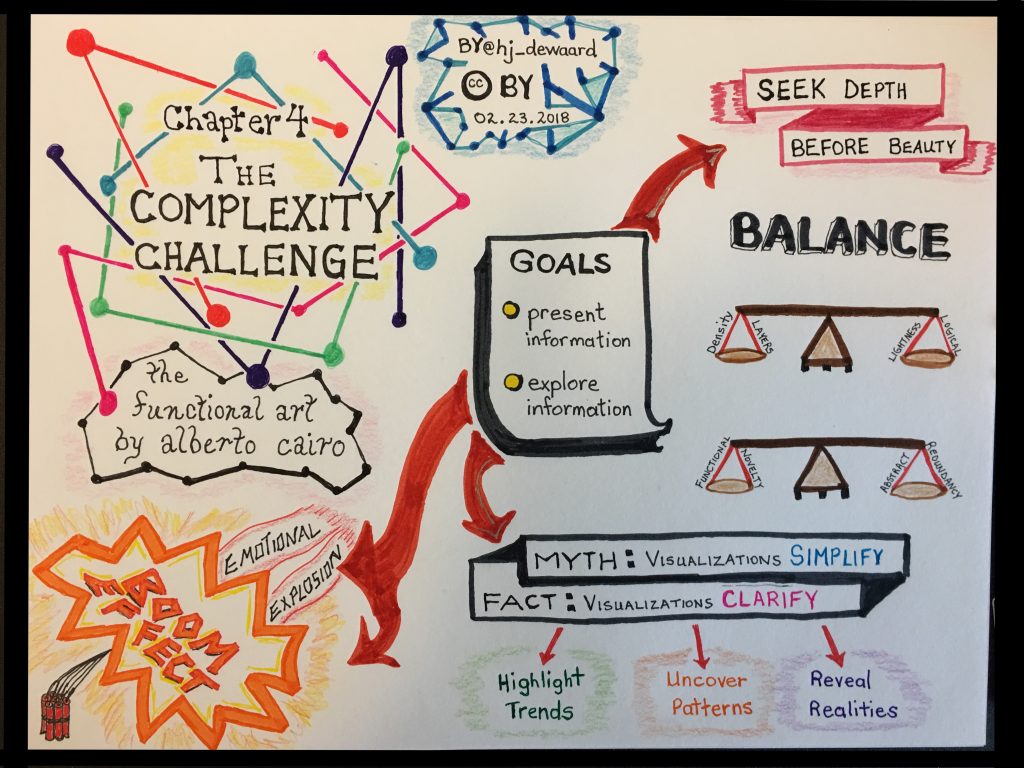
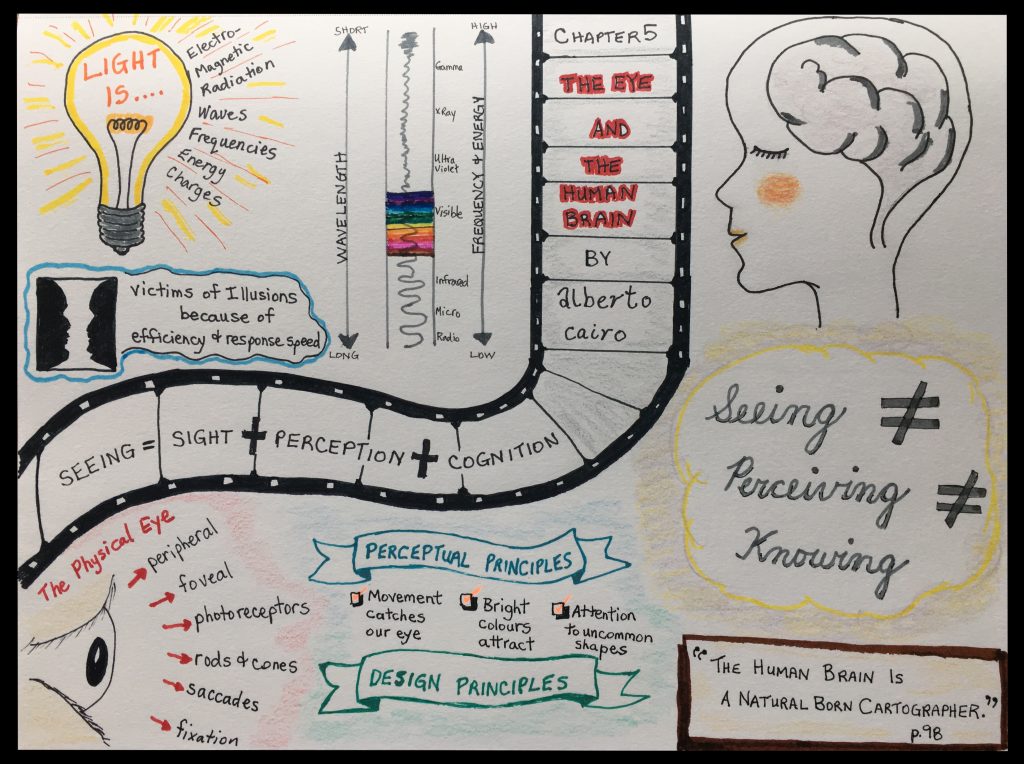
This is a collection of images I’ve created as a chapter by chapter review of the book The Functional Art: An introduction to information graphics and visualization by Alberto Cairo (2013). Further information is available on the related website about the book.
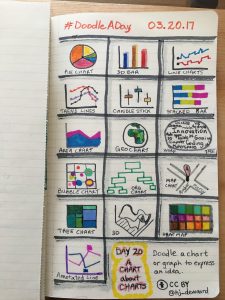
This began from a series of graphic images I was creating during a Doodle-A-Day activity where I created a Chart About Charts.


Subsequent sketchnote visualizations will be added here as they are completed.