Month: March 2019

Data Visualization

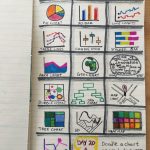
This is a collection of images I’ve created as a chapter by chapter review of the book The Functional Art: An introduction to information graphics and visualization by Alberto Cairo (2013). Further information is available on the related website about the book. This began from a series of graphic images I was creating during a

Defining MY open

Defining and Refining Definitions of ‘Open’ and ‘Fellowship’ Defining my open was shaped by the application video for the OEFellows with eCampus Ontario. My notion of “open”, in reflection of my open fellowship experiences with eCampus Ontario, has shifted through multiple meanings and multilayered understandings, as suggested by Pomerantz and Peek (2016) in Fifty Shades
css.php